

Appearance
AN INTELLIGENT FINANCIAL PREDICTION AND LEARNING SYSTEM
Why FIN?
Fin has six pillars
1
Data OverloadThousands of news articles daily. No human can keep up. FIN reads them all.
2Psychology Insights12 cognitive biases (FOMO, herding, loss aversion...) measured from news — because markets aren't always rational.
3Statistical FoundationPrice history, volume trends, and financial fundamentals — analyzed with real statistics, not guesswork.
4Machine LearningLearns from your past predictions and actual outcomes to spot repeating patterns.
5Self-CorrectionCatches its own mistakes — automatically downgrades models that stop working.
6AI & LLMAI synthesizes every signal into a clear thesis with a price target and confidence range.
What Does FIN Do?
Always watching the market
Tracks prices, news, social media, earnings, psychology research, and sovereign rates/FX around the clock
Turns noise into signalScores sentiment, flags surprises, and measures investor psychology to separate what matters
A forecast with a rangeNot a single guess — a predicted price plus a confidence range, for 1, 2, and ~10 days out
Honest about its track recordAfter the close, it checks how far off it was and feeds the result back to improve
Gets sharper every weekResolved predictions become training data — models retrain and underperformers are retired automatically
Shows its reasoningEvery prediction includes the full why and a Model Reconciliation summary
Two Brains, One Honest Verdict
Most systems hand you a single number and call it a day. FIN runs two independent forecasters — an AI that reads the news and builds a thesis, and a machine-learning model trained on your own history — then reconciles them in the open. You always see how the final call was made, and FIN is honest when the two disagree. A third, statistical opinion is used in every reconciliation as an independent cross-check.
They agree
When the AI and the model point the same way, confidence gets a small boost — two independent methods converging is a strong signal.
They disagree
The confidence band widens and confidence drops — scaled to how far apart they are. A $120 vs $105 clash gets a much wider range and lower score than a $120 vs $118 near-miss. No fake precision.
A separate, market-based check also widens the band when the options market is pricing a bigger move than the model allows — so a wide range reflects real uncertainty, not a flaw.
Evidence is thin
When either side is uncertain, the forecast is pulled toward a flat, neutral estimate instead of a confident bet — guarding against overconfidence.
AI Thesis Forecast+ML Model Forecast→Reconciled Verdict
See exactly how each prediction was reconciled in the Model Reconciliation guide.
All of this happens automatically every day. Your job is to explore the results, tune the system and understand the story behind each prediction.
- Your predictions, your context — every prediction is personalized to YOUR tickers, news feeds, and settings
- Add competitor tickers to factor in peer performance and news sentiment
- No two FIN instances are alike — you are in control
Why Use FIN?
| You want to know... | FIN tells you... |
|---|---|
| What will the stock be worth tomorrow / next week? | Predicted price with a confidence range |
| Why does the system think that? | Full reasoning for every prediction |
| What news is driving the sentiment? | Scored articles with relevance and bias |
| Are people acting irrationally? | Psychology bias scores (FOMO, herding, etc.) |
| Was the prediction accurate? | Track record with error percentages |
| Is the market surprised by something? | Surprise signal detection from news |
| How does my stock compare to its peers? | Competitor price, valuation, and news sentiment comparison |
| Does it get better over time? | Yes — it learns from its mistakes via a closed feedback loop, retrains ML models, and auto-retires underperforming ones |
| What would prove the prediction wrong? | Falsifiable hypotheses — concrete testable conditions monitored daily (e.g., "if RSI > 70, thesis is weakened") |
| Does it work immediately? | Yes — predictions from day 1; ML models typically train within the first week using historical backfill |
| How reliable are the confidence bands? | Statistically calibrated to guarantee ~80% coverage on past data |
| What about market positioning? | Options data (put/call ratios, implied volatility) is factored into every prediction |
| How's the system running? | Jobs, feeds, schedules overview |
| Do the AI and the model agree? | FIN reconciles two independent forecasters and tells you — agreement means a more confident call |
| What if they disagree? | The confidence band widens and confidence drops in proportion to the gap, so you're never shown false precision |
| Can I trust the confidence number? | Confidence is capped by data quality — if the input data was stale or incomplete, FIN lowers the score even when the model is certain |
The Pipeline: How FIN Works
Every day, FIN automatically runs through five stages — no manual work needed:
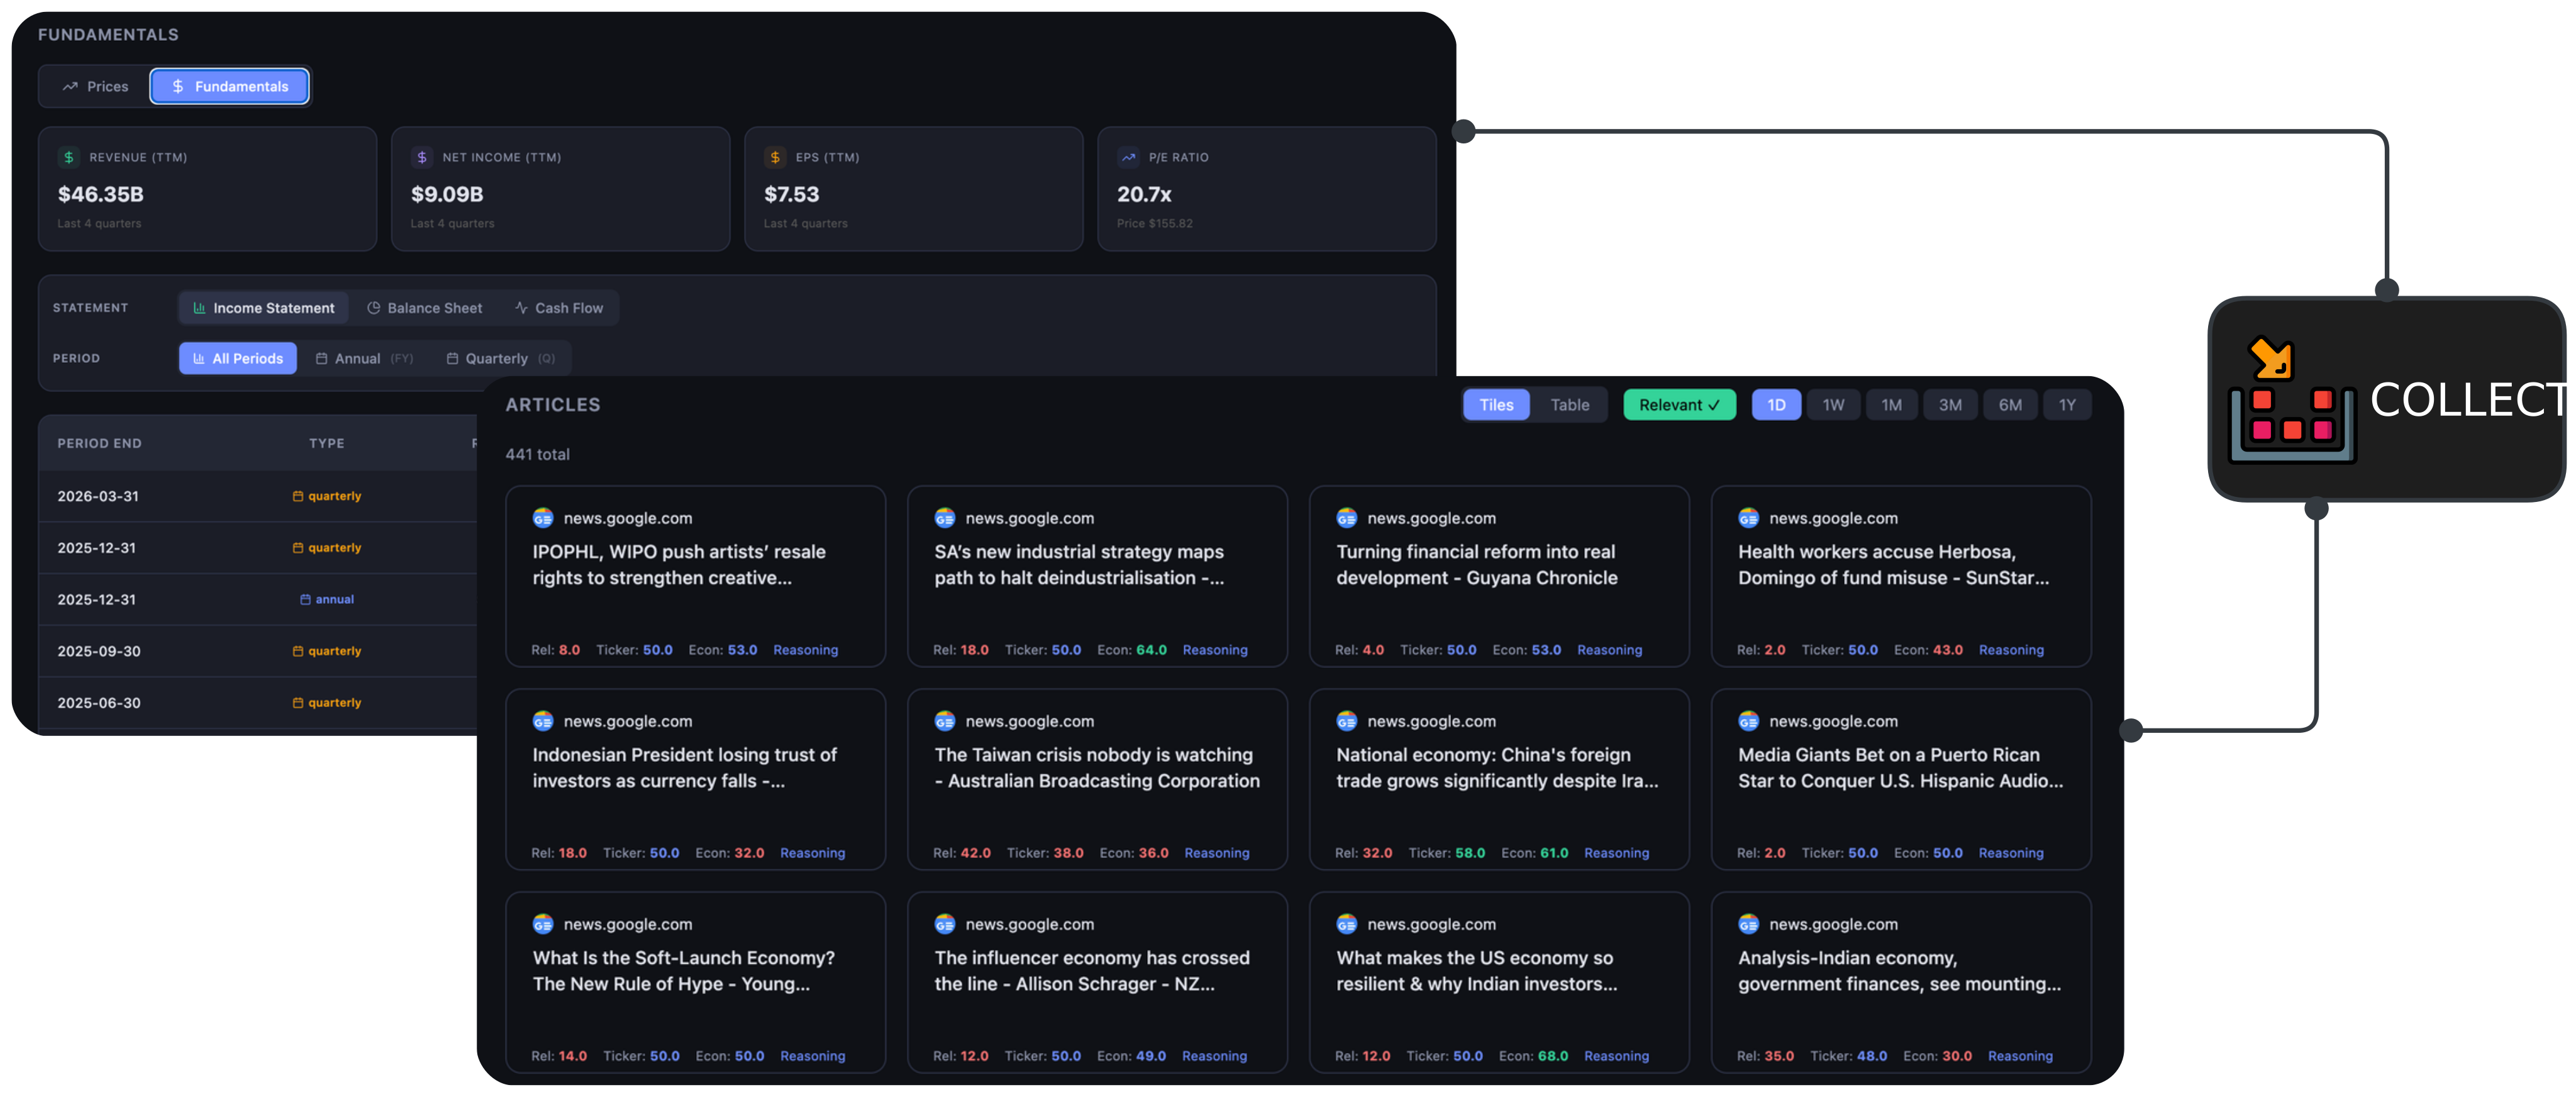
Stage 1: Collect
FIN pulls in data from multiple sources:
- Stock prices — daily trading data (Open, High, Low, Close, Volume)
- News articles — from RSS feeds (Google News, Yahoo Finance, Reddit, etc.)
- Calendar events — earnings dates, dividend dates
- Financial statements — income, balance sheet, cash flow
- Options data — put/call ratios, implied volatility, and IV percentile from the options chain
- Psychology research — academic studies on 12 cognitive biases
- Competitor data — peer stock prices, financial metrics, and news sentiment for relative performance analysis
- Sovereign rates & FX — USD and EUR government bond yields (2Y, 5Y, 10Y) and EUR/USD exchange rate for macro-economic context
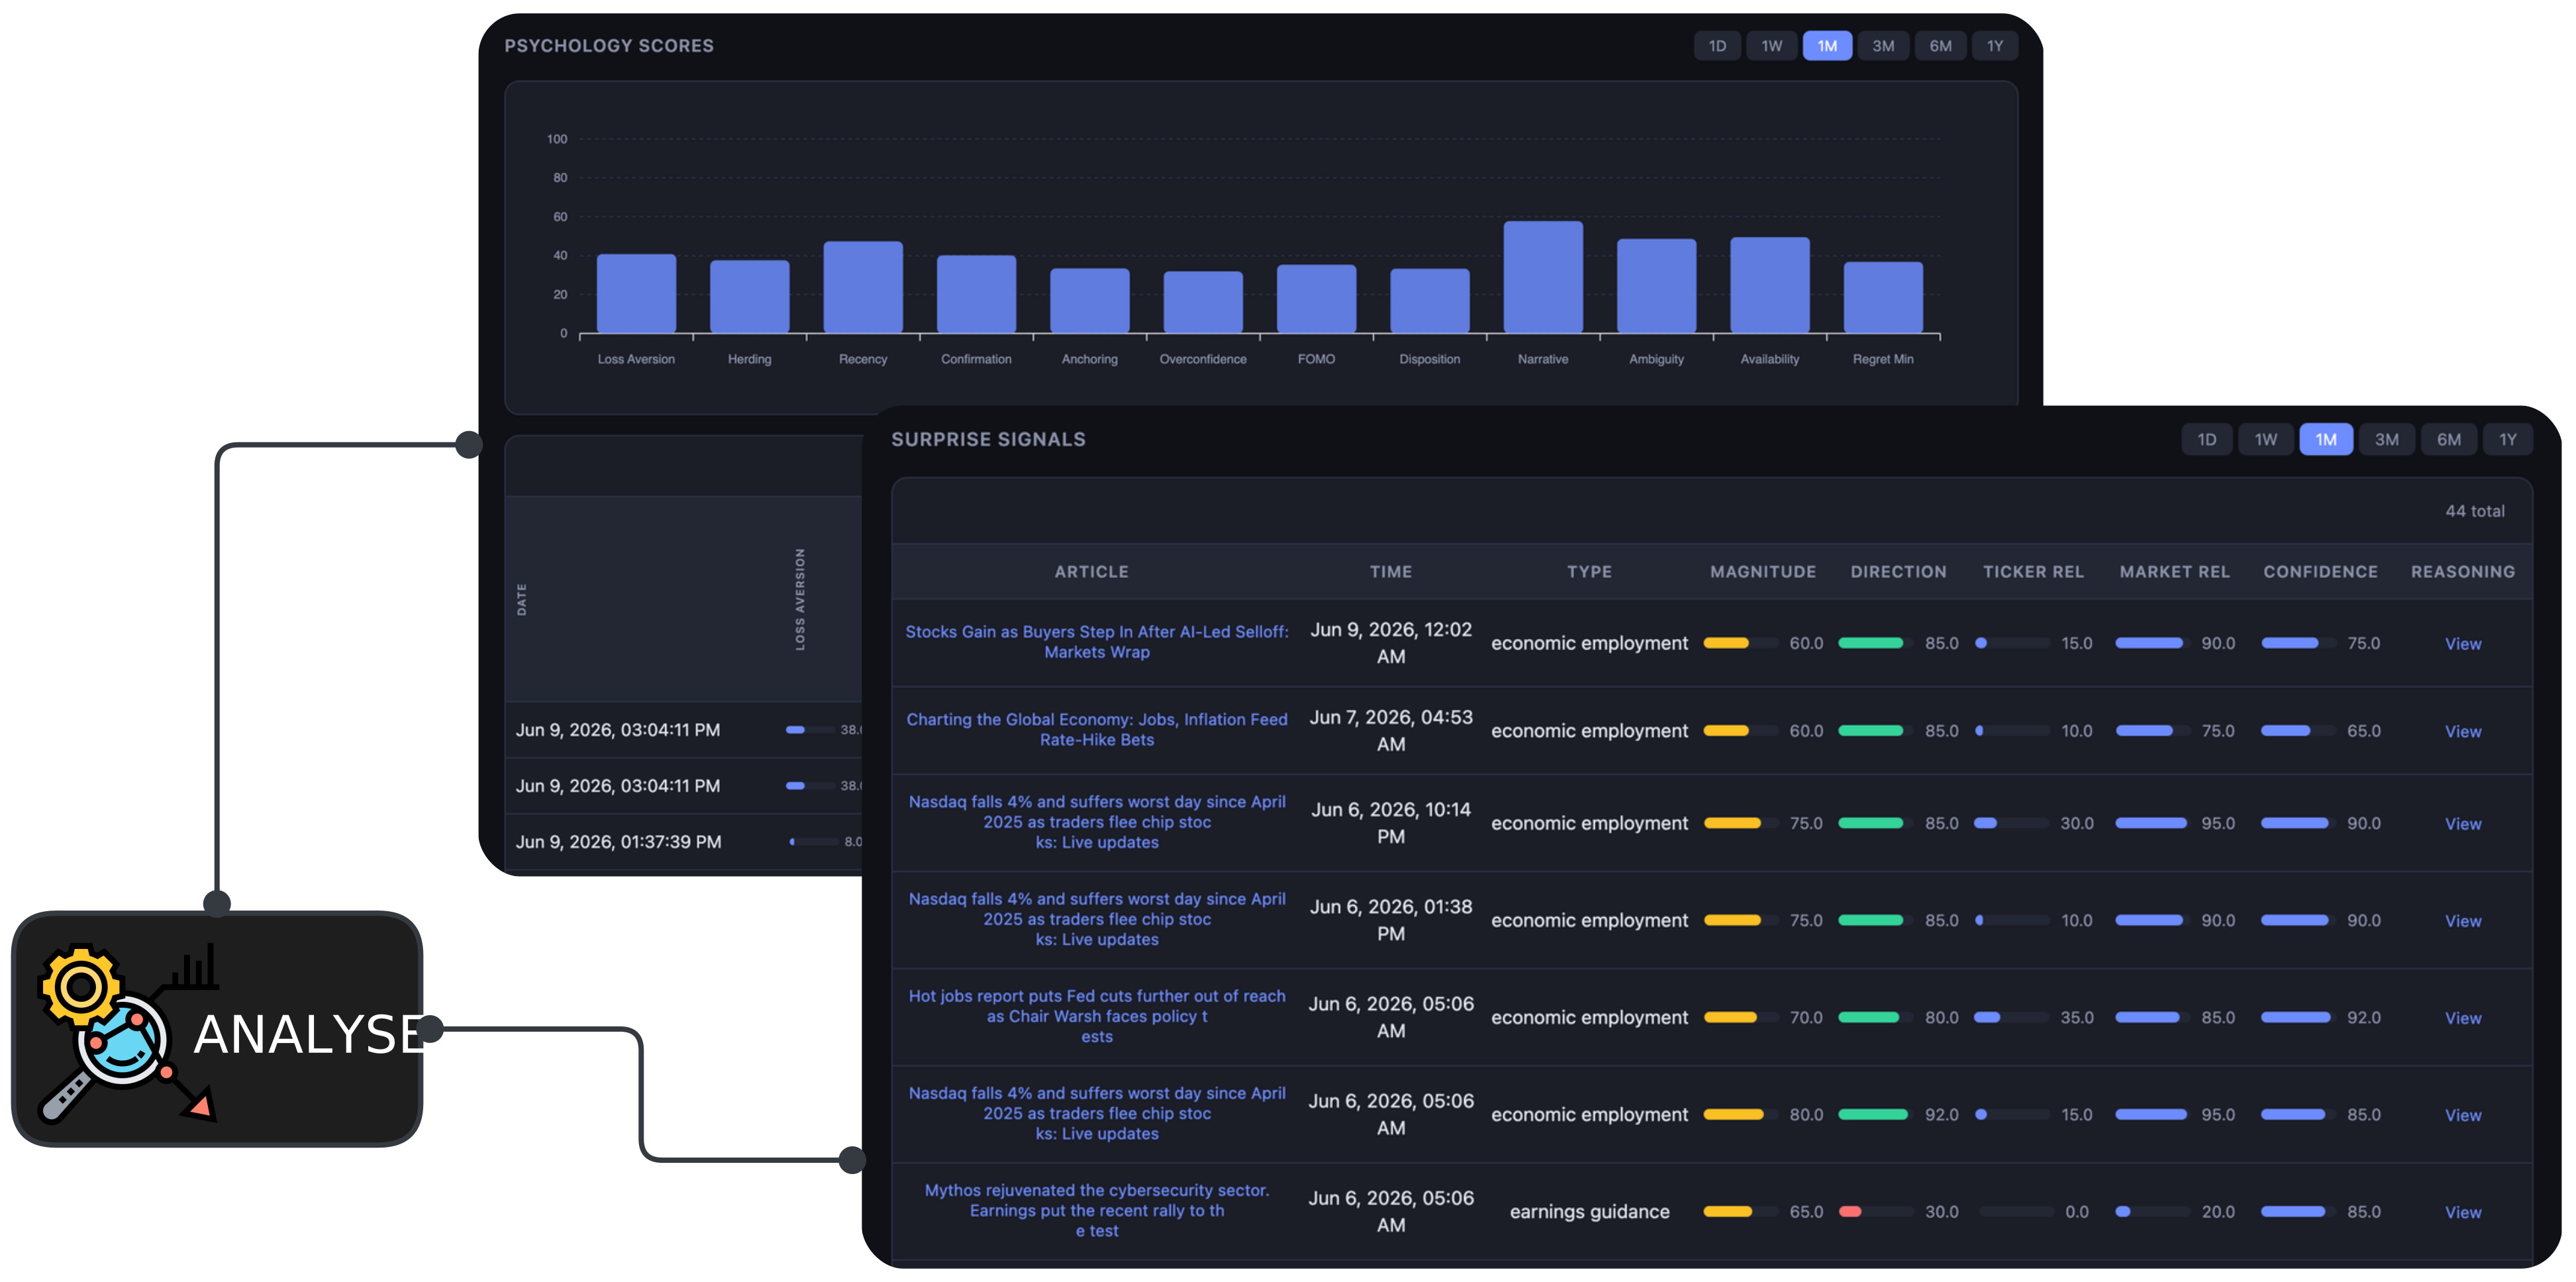
Stage 2: Analyze
Raw data is transformed into useful signals:
- Sentiment Analysis — every article is scored for how positive/negative it is about the company and the economy
- Surprise Detection — looks for unexpected events (earnings beats/misses, economic surprises)
- Psychology Scoring — measures 12 cognitive biases (FOMO, herding, loss aversion, etc.)
- Technical Indicators — RSI, moving averages, and volume trends from price data
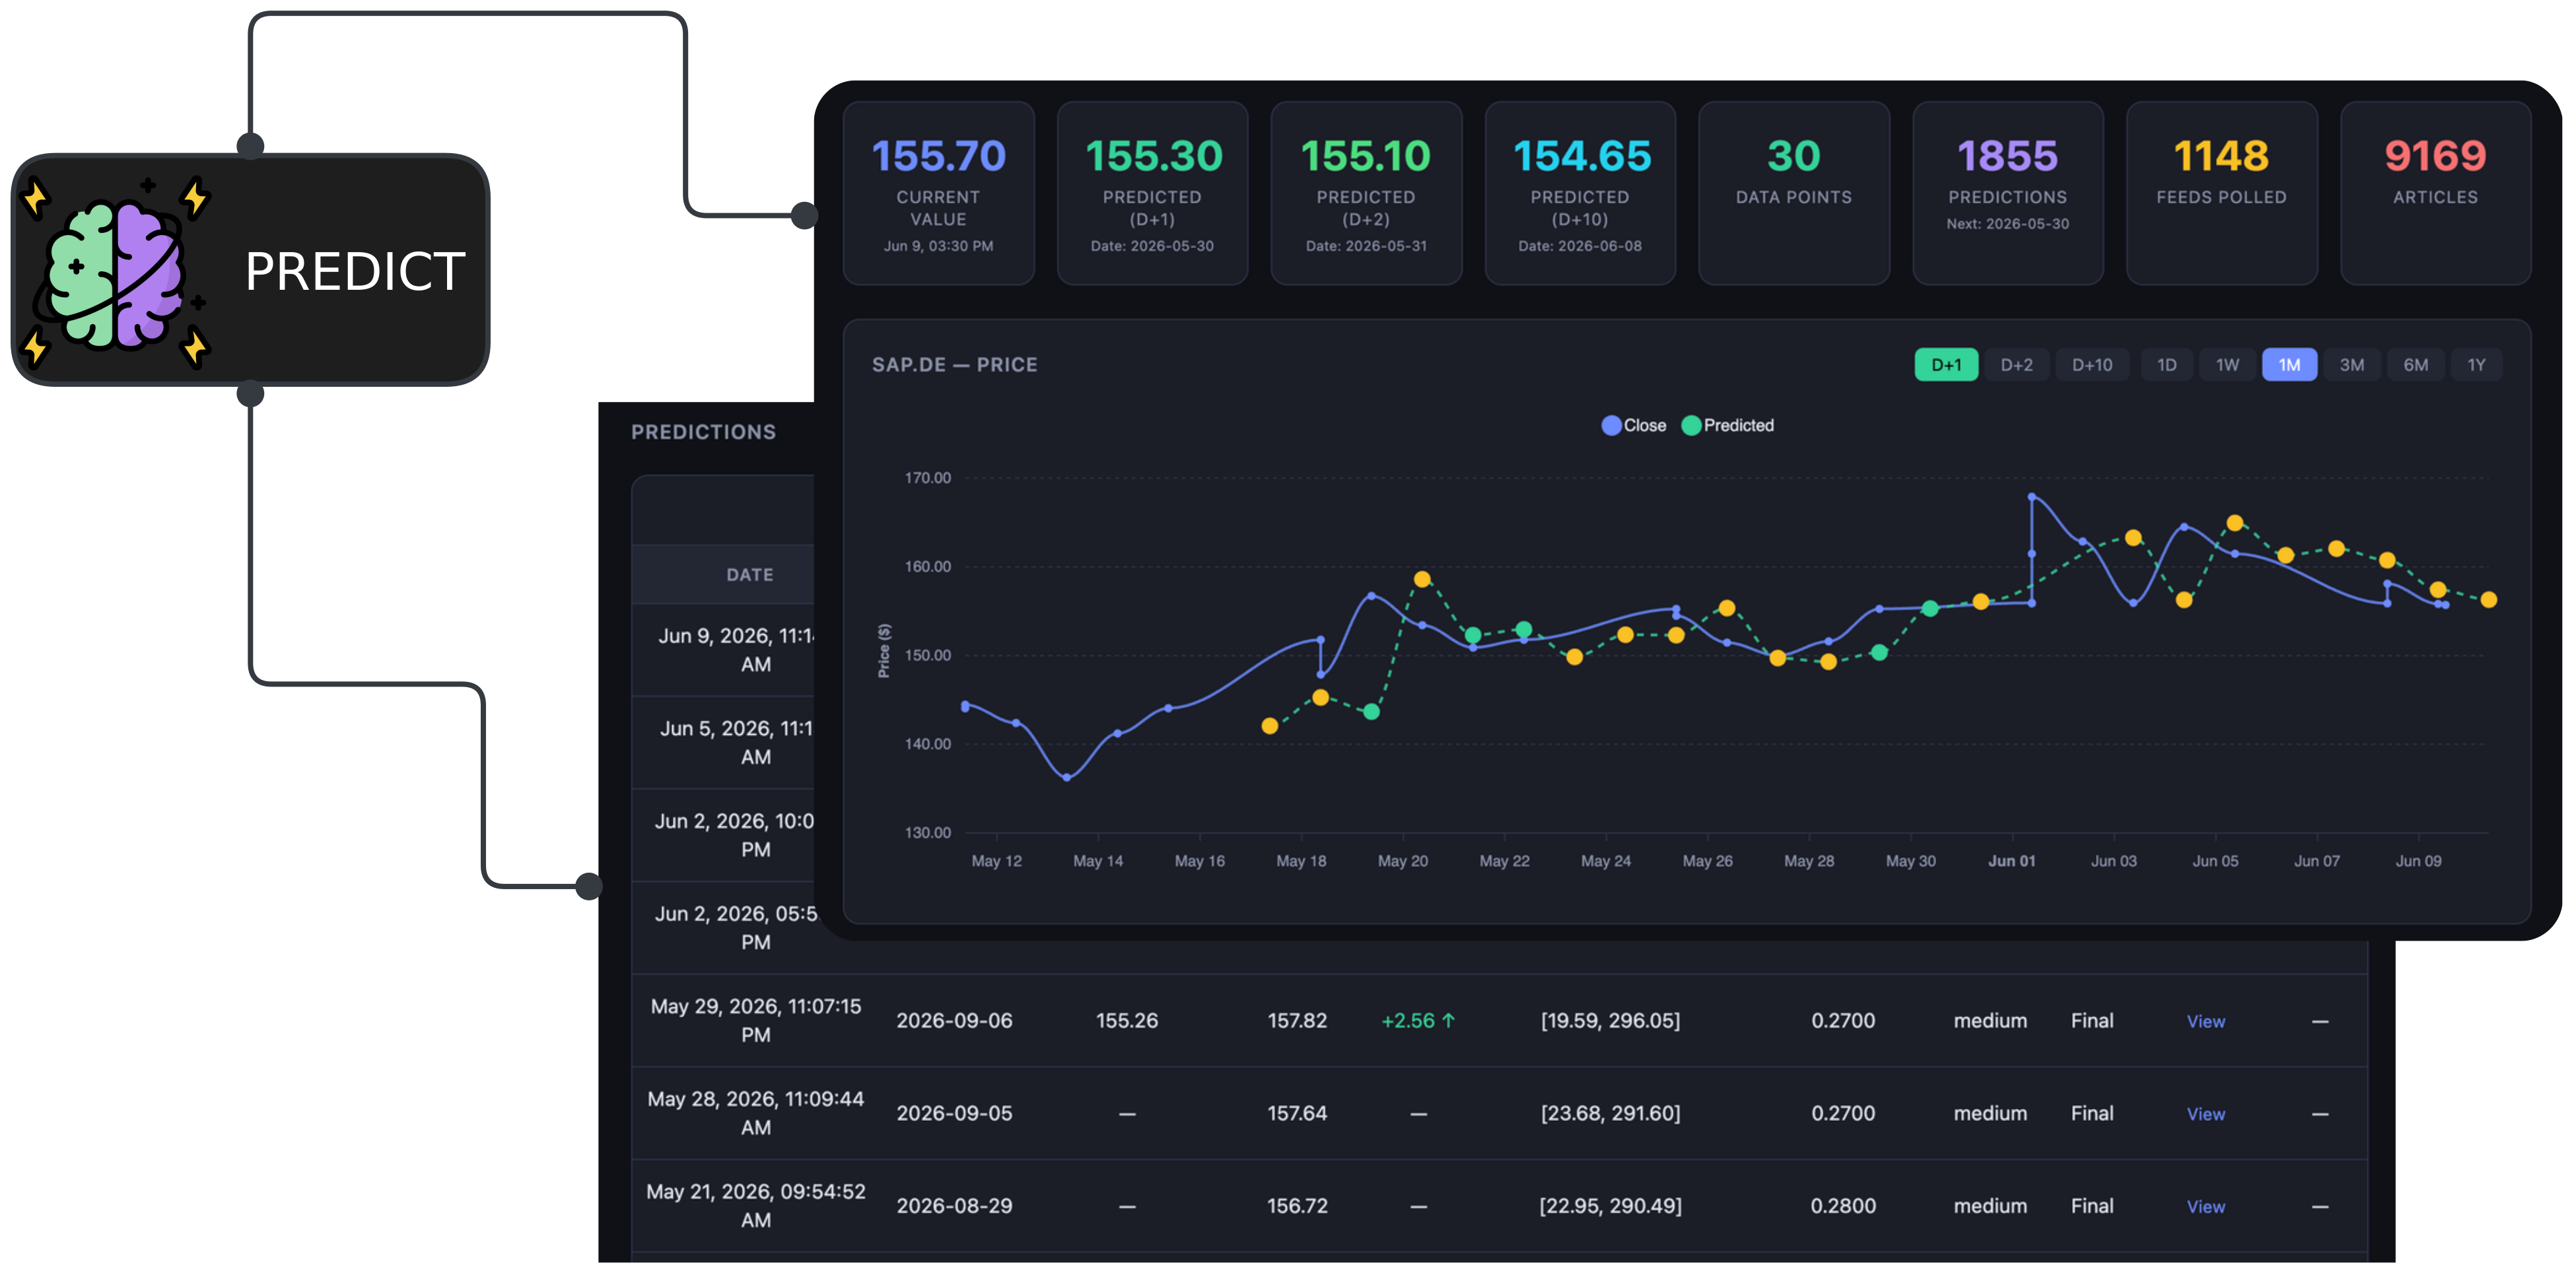
Stage 3: Predict
All analyzed signals flow into a thesis-first, tiered prediction pipeline:
Step 1 — Thesis Generation
Before any price number is produced, the LLM generates a qualitative thesis: a structured view of the stock's direction, conviction strength, bull/bear scenarios with probabilities, and falsifiable hypotheses (e.g., "If RSI drops below 30, this thesis is wrong"). This thesis anchors every downstream prediction.
Step 2 — Tiered Price Prediction
The system picks the best available method to turn the thesis into numeric prices:
| Tier | Method | When Available |
|---|---|---|
| Tier 1 | Your personal quantile ML model (q10–q90) | After ~100+ resolved snapshots |
| Tier 2 | Pooled ML model (cross-user) | After enough data accumulates |
| Tier 3 | Sector-transfer ML model | When a peer company is trained |
| Tier 4 | Thesis heuristic (direction + magnitude) | Always — no training needed |
Each tier is automatically downgraded if its recent accuracy is poor.
Step 3 — Self-Critique
A second LLM pass reviews the thesis for consistency, plausibility, and falsifiability before the final prediction is saved.
What You Get
Predictions for 1 day, 2 days, and ~10 days ahead — each with a confidence range, a confidence score, and full thesis reasoning explaining the why. Competitor context is injected when peers are configured, and a MAPE gating check prevents flaky predictions from being shown. Every prediction also includes a Model Reconciliation summary (see the guide) showing whether the AI and the model agreed or disagreed, and how far apart they were.
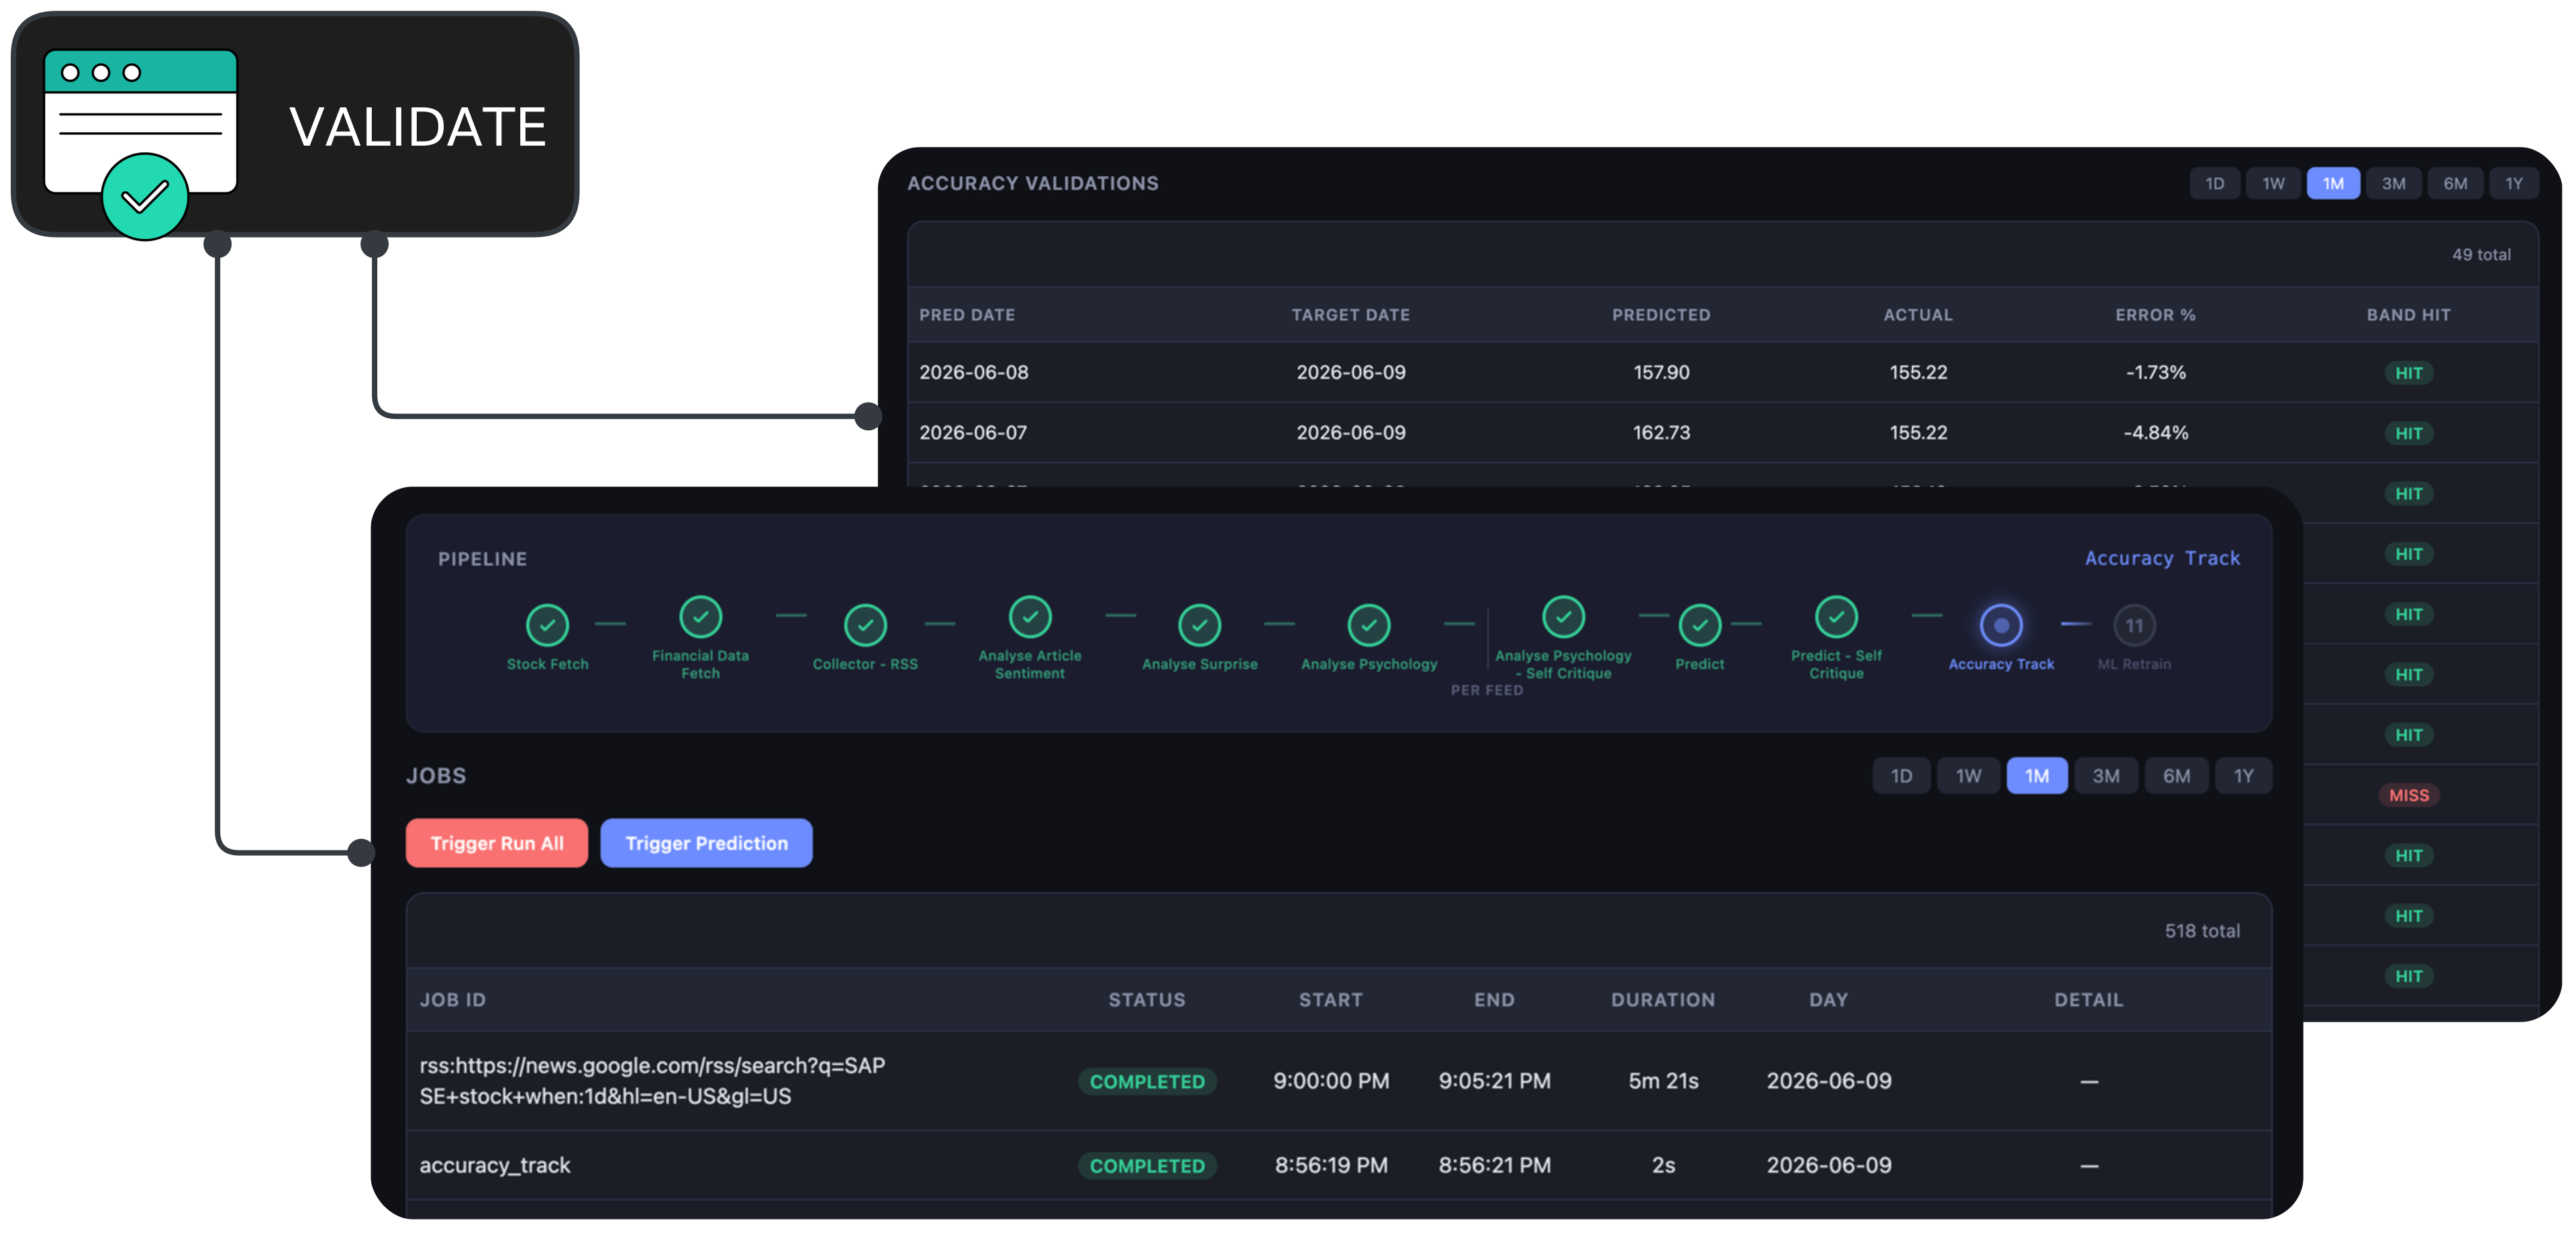
Stage 4: Validate
After market close, FIN checks its work:
- How far off was the prediction? (error percentage)
- Did the actual price fall within the expected range? (band hit)
- Results are fed back into the learning system
Note: Intraday (intermediate) predictions are marked as provisional — they are rough updates during the day and are clearly labeled as not final.
Stage 5: Learn
The system improves over time through a closed feedback loop:
Feature Snapshots
Every prediction saves a feature snapshot — a complete record of everything that fed into it: technical indicators, sentiment scores, psychology biases, financial fundamentals, options data, sovereign rates/FX, and thesis features (conviction, regime, flip count). When the target date passes, the accuracy tracker resolves each snapshot with the actual outcome (actual price, return %, error %), turning it into a labeled training example.
Quantile ML Training
Once enough resolved snapshots accumulate (100+), the system trains quantile GBM models — five models that predict different points on the return distribution:
| Model | What It Predicts |
|---|---|
| q10 | Pessimistic case (10th percentile) |
| q25 | Conservative case (25th percentile) |
| q50 | Median (most likely) case |
| q75 | Optimistic case (75th percentile) |
| q90 | Very optimistic case (90th percentile) |
The q50 gives the central price; the q10–q90 gap forms the confidence band, optionally tightened by conformal prediction to guarantee ~80% coverage on held-out data. The trained model is user-specific — it learns from your chosen tickers, feeds, and settings. Backfilled (historical) samples are weighted lower than live samples during training so the model prioritizes real outcomes. If performance drops, old models are retired automatically and the system falls back to Tier 4 (thesis heuristic) until fresh models can be trained.
Leg Feedback (Self-Improving Legs)
Every resolved prediction is also scored per leg — what the AI baseline alone and the ML model alone would have achieved. When one leg is systematically off (e.g. the model running 5% too high while the AI stays within 1%), the next forecast automatically corrects that leg's bias and reduces its weight in the blend, within safe bounds. The model's weight in the blend also scales with its win rate — a badly-losing model is near-excluded rather than dominating. Large disagreements trigger a written diagnosis explaining which leg failed and what changed. You can see all of this on the prediction's Reasoning page: the Leg Feedback card, the tuning row in Model Reconciliation, and the per-leg error columns in Jobs → Accuracy Track.
Quick Start: Using the Dashboard
1
Select a Stock
Pick a ticker from the top bar. Predictions appear immediately — no waiting.
2
Explore Your Predictions
Check the Dashboard for price forecasts, confidence ranges, and the AI reasoning behind each one.
3
Add Competitors
Optional — add rival tickers so the system factors in peer performance and news when predicting.
4
Tune the System
Optional — choose which news feeds to monitor, adjust the AI settings, and set the prediction schedule.
5
Track Results
Check back after market close to see accuracy scores. The system learns from its mistakes and improves over time.
What's New
- Sovereign Rates & FX context — predictions now include USD and EUR government bond yields (2Y, 5Y, 10Y) and EUR/USD exchange rate as macro-economic context, both in the AI thesis and as ML features. Enabled by default.
- More honest confidence bands — the confidence band now has two independent floors: a hard options-implied floor (the band can never be narrower than what the options market prices in) and an empirical-error floor (the band is widened if tighter than the stock's own observed error rate).
- Cleaner reconciliation panel — the Model Reconciliation panel now lists only the views that actually contributed to the final forecast, not all possible views.
- Backfill data no longer dominates training — historical backfilled samples are now weighted lower than live samples during model training, so the model prioritizes real outcomes over simulated history.